
AI and automation
Business reports and insights
We pull data from your systems into dashboards and scheduled reports, so managers see sales, cash, stock and performance without waiting for someone to build a spreadsheet.
Overview
Dashboards that show the figures that matter, every morning.
Managers make better decisions when the figures are current and trusted. Too often, reports are built by hand each week, departments quote different numbers for the same thing, and nobody is sure which spreadsheet is right. Dashboards and scheduled reports drawn directly from your systems give everyone the same figures, ready each morning.
Our first task is agreeing a short list of key figures, how each is calculated and who needs it. We then connect your systems and check the source data, flagging missing, duplicate or mismatched records before they reach a chart. Dashboards are built by branch, product or person, and managers compare the figures with their own before sign-off.
The result is a set of dashboards, a report schedule and a data dictionary explaining every figure, so disagreements are settled quickly. Access is set by role, so each manager sees their own area. Reporting of this kind already serves a grocery retailer, a cookware distributor and a private client with several businesses. New reports can be added over time on a care plan.
- What you receive
- Dashboards · Report schedule · Data dictionary
- Typical technology
- PostgreSQL · Metabase · Chart.js · Python
Who it's for
Is this right for you?
If your figures come from one system that already has good reports, setting those up properly may be enough.
- Managers waiting for someone to build this week's spreadsheet
- Departments quoting different figures for the same thing
- An owner who wants sales, cash and stock on one screen each morning
Scope
What goes into it
Every engagement is scoped to your goal. These are the parts most projects include.
- DashboardsLive figures by branch, product or person.
- ExportsCSV, Excel and PDF in your formats.
- Multi-currencyFigures in several currencies side by side.
- Data qualityChecks that catch missing or duplicate records.
Timeline
How a typical project runs
Usual length: usually 4 to 10 weeks. Your written scope gives the exact plan.
01Weeks 1–2
Agree the key figures
We agree a short list of figures, how each one is calculated, and who needs to see them.
02Weeks 2–4
Source data checks
We connect your systems and flag missing, duplicate or mismatched records before they reach a chart.
03Weeks 4–8
Dashboard and export build
We build dashboards by branch, product or person, plus the CSV, Excel and PDF exports you need.
04Weeks 8–10
Scheduled emails and sign-off
Reports are scheduled to the right inboxes, and managers check the figures against their own before sign-off.
One-time project
A fixed quote for an agreed scope, paid in milestones. You own the code and accounts once it's paid.
Monthly care plan
A monthly subscription that keeps your software secure, monitored and improving, with response times in writing.
Industries we have built this for
Getting started
What happens after you get in touch
- 01Tell us the problemA short form or a call. A senior lead replies within one working day.
- 02One callWe sign an NDA first if you need one, then go through your goals, users and current systems.
- 03Written scope and fixed quoteWithin 48 hours of the call, with milestones and a timeline.
- 04Build in milestonesYou see working software at every milestone, and you own what we build.
Questions
Before you ask
What changes the size of the job
- How many systems the data comes from
- How clean and consistent the source data is
- The number of dashboards, reports and user groups
Can reports be emailed automatically?
Yes, daily, weekly or monthly, to whoever needs them.
What if our own figures don't match the dashboard?
We trace the difference back to the source records together. The data dictionary sets out how each figure is calculated, so disagreements are settled quickly.
Can each manager see only their own branch?
Yes. Access is set by role, so a branch manager sees their branch and head office sees every branch.
How is this priced?
As a one-time project with a fixed quote, agreed after a short call and paid in milestones. After launch you can add a monthly care plan for hosting, updates and support.
Previous work
Projects in this area
The first three projects used this directly; the others are related work from AI and automation.
 Client details hidden
Cookware distributor
Sales and accounts system for a cookware distributor
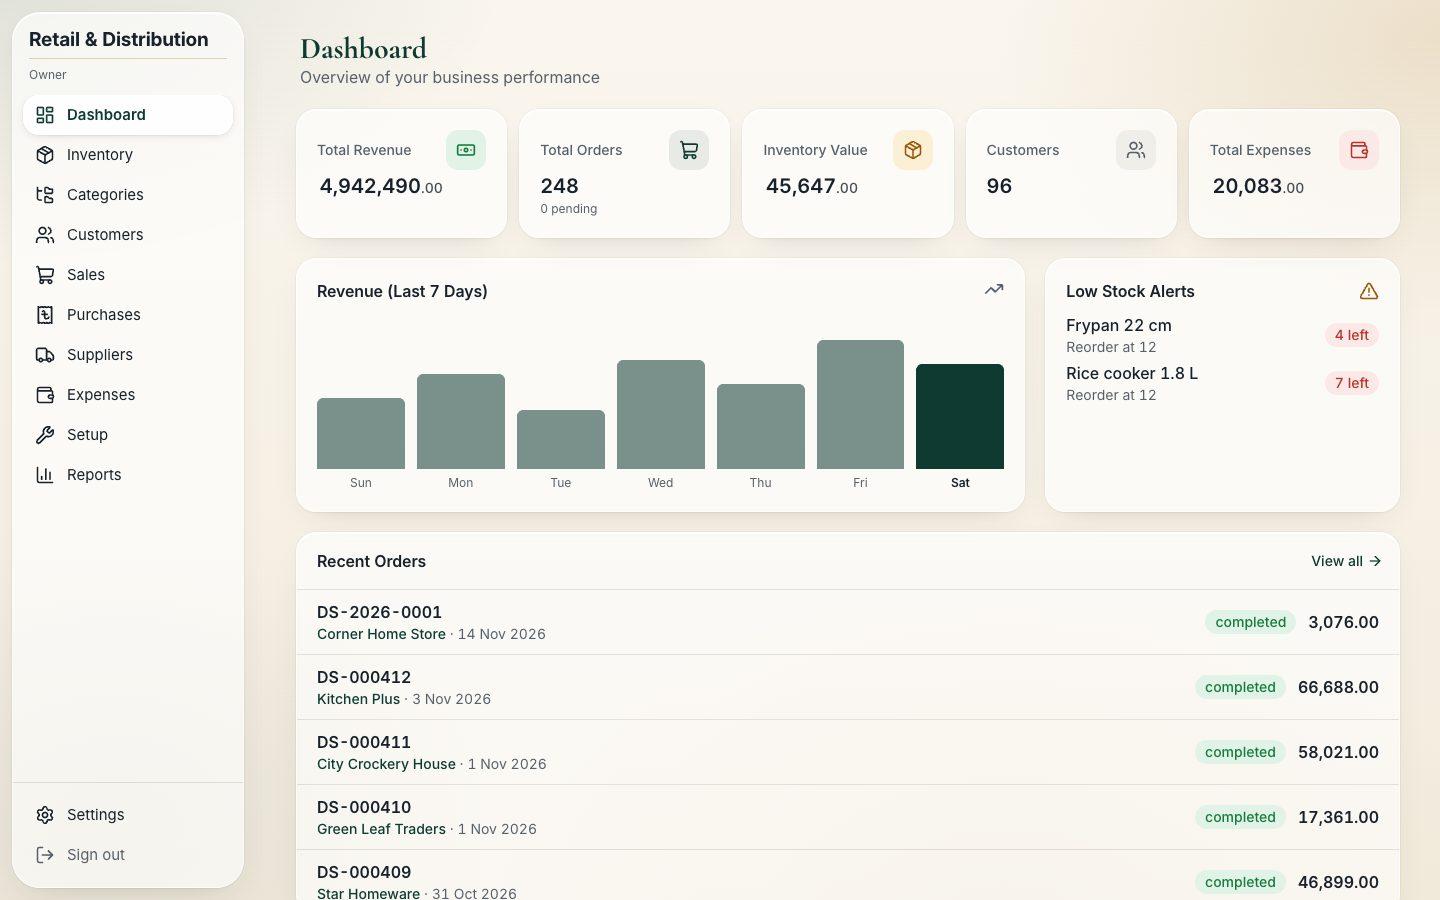
We built a system to invoice shops, collect payments, buy stock and keep the ledgers balanced.We built the system a cookware dealer uses to invoice retail shops, collect payments, buy stock and keep every ledger in balance.
See what we builtGrocery retailer, Southern Europe
Finance portal for managing two grocery shops
We built a portal where the shops record takings, expenses and till counts, with live balances.We built the portal the shops use to record takings, expenses, supplier purchases and daily till counts, with live balances for each shop.
See what we builtPrivate client, Europe
Finance app for tracking money across several businesses
We built an app that tracks money in several currencies and produces monthly reports.We built the installable app that records money sent and spent in several currencies, carries balances forward and produces monthly reports.
See what we built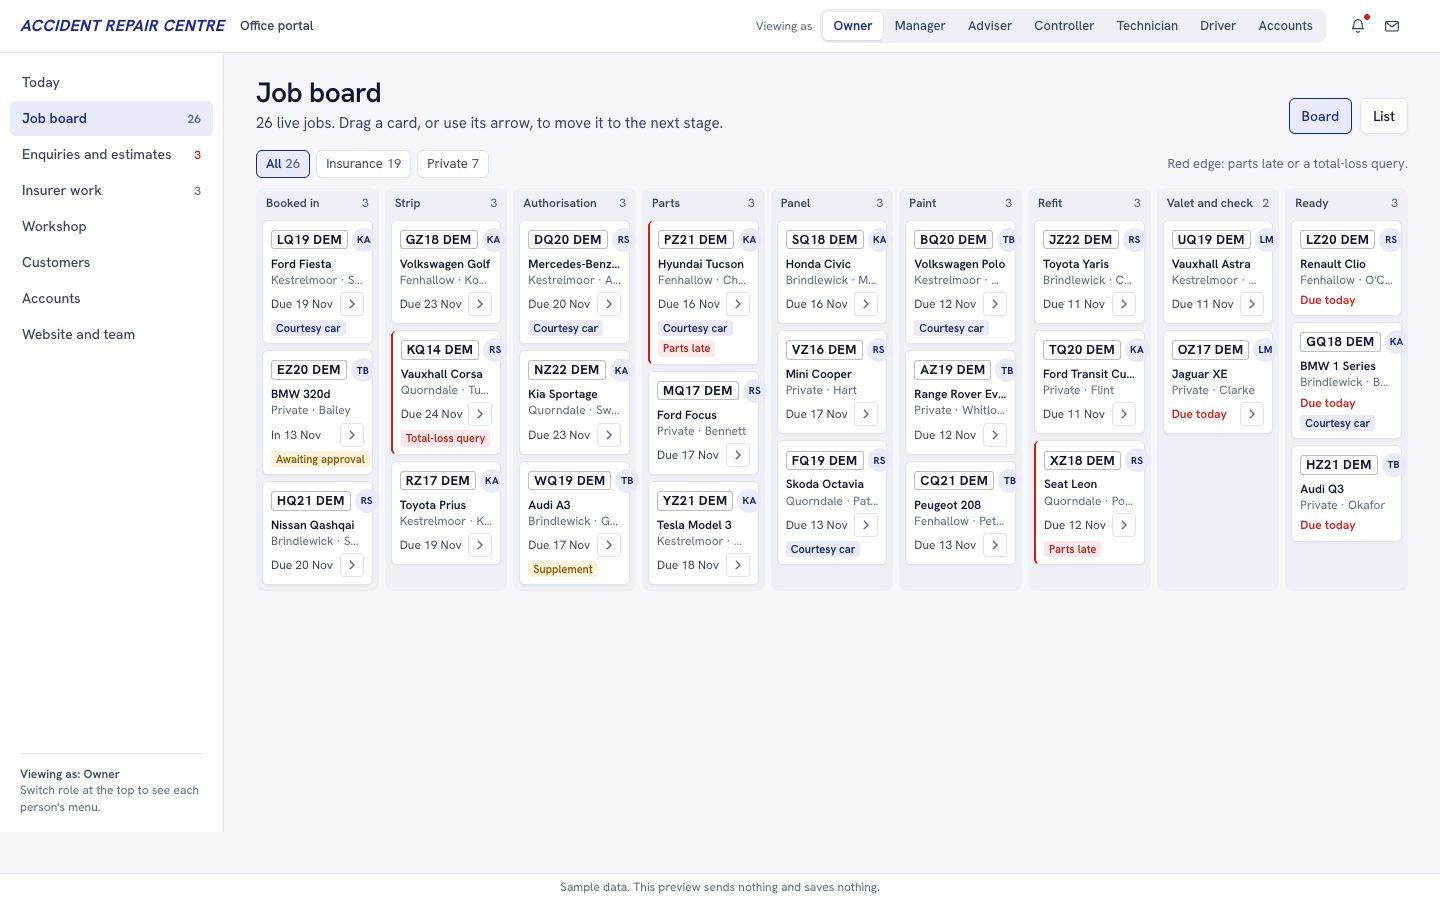 Client details hidden
Accident repair centre, UK
Website and portals for an accident repair centre
We built a website with photo estimates, booking and repair tracking, and an office job portal.We built a new website with photo estimates, booking and repair tracking, a light customer portal and an office portal that runs every job from booking in to handover.
See what we builtMore in AI and automation
Tell us what you need built.
Share the problem in a few lines. After one call you'll get a written scope and a fixed quote within 48 hours.